Metabase: An Open-Source Business Intelligence Tool for AI & ML
Introduction
Effective presentation and interactive visualisation of outputs from various machine learning models are vital aspects of bringing Artificial Intelligence (AI) and Machine Learning (ML) close to actual businesses. In this respect, Business Intelligence (BI) tools play a significant role in bringing various AI & ML insights into the hands of business experts. The typical work-flow of BI tools, at least in the context of AI & ML, includes the followings:
- Bringing data from various sources (e.g., from AI models via databases (DBs))
- Creating plots which answer various business questions
- Creating dashboards which provide various business insights in terms of collection of a large number of plots (or KPIs)
- Deploying the application either on-premise or in cloud.
To this end, BI tools often come up with features such as capabilities to create various plots and dashboards, easy integration with various database systems, etc. Although it is subject to the problem (or rather the business requirement) at hand, I often weigh the BI tools based on the following features:
- Ease of use
- An open-source or a commercial tool
- Ability to easily connect to various databases
- Ability to create various kinds of plots which are suitable to present data of different forms
- Ability to apply various filtering features during the creation of dashboards
- Easy deployment in cloud services such as AWS, Azure, Heroku or Google cloud.
I recently came across an interesting open-sourced BI tool called Metabase. As a basic-level user of Qlik, I was quickly impressed by the simplicity of Metabase. In this article, I will discuss about various aspects of building an AI dashboard using Metabase, and deploying it in AWS.
Metabase in AWS
I used AWS Free-Tier account in order to deploy Metabase in AWS for free. Metabase works very well with a basic EC2 T3 instance (either type micro or small). EC2 in Free Tier comes up with 750 free hours per month which was good enough for my case. In order to deploy the application in AWS, you can refer to one of these links: Metabase easy deployment , Metabase custom deployment or Youtube video . The following figure provides a snapshot of various application-level interactions such as logging-in, listing-DBs, setting up datamodel & authentication, etc. More information on the first-level application setup can be obtained from the official documentation.
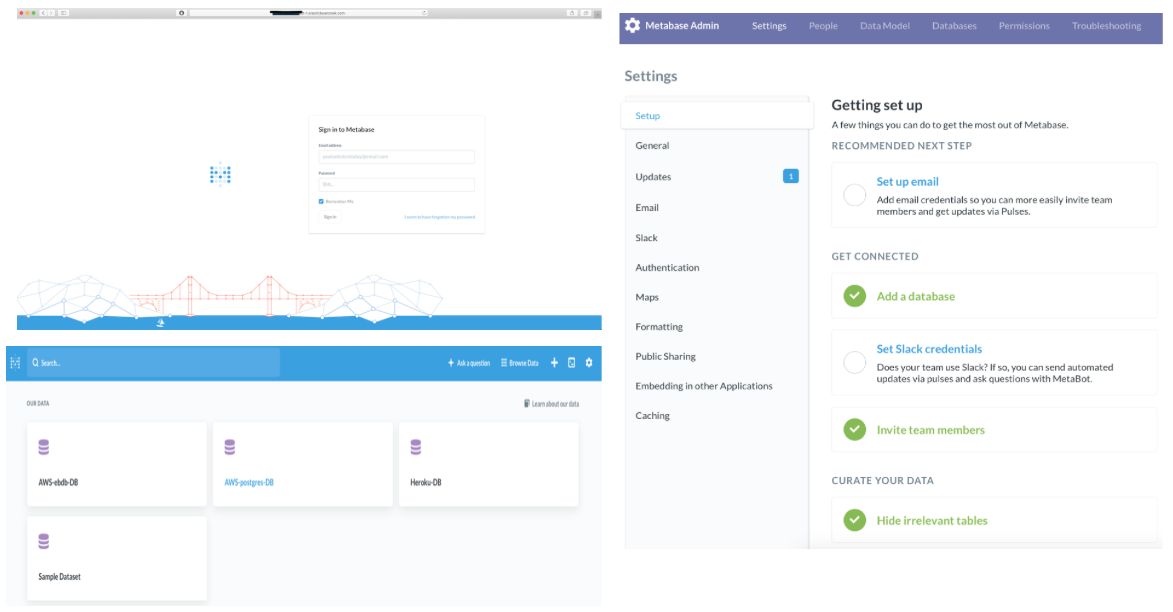
Application home page and setup options
Database Integration
As any other BI tool, Metabases receives data from databases. Some of the databases which are currently supported by Metabase include:
- Amazon Redshift
- Google Analytics
- SparkSQL
- Postgres and many others
A database can simply be integrated by accessing the Admin:DATABASES portal of metabase as shown in the following figure. Metabase does not save a copy of the original data located at the remote databases. Thus it is important to activate the database synching options. Metabase syncs every hour by default although it can be customised to business needs. If the DB is significantly large in size, then the synching can be performed manually whenever necessary. SSH tunneling features are available to keep the database connections secure. More information on database management in Metabase can be obtained from here.
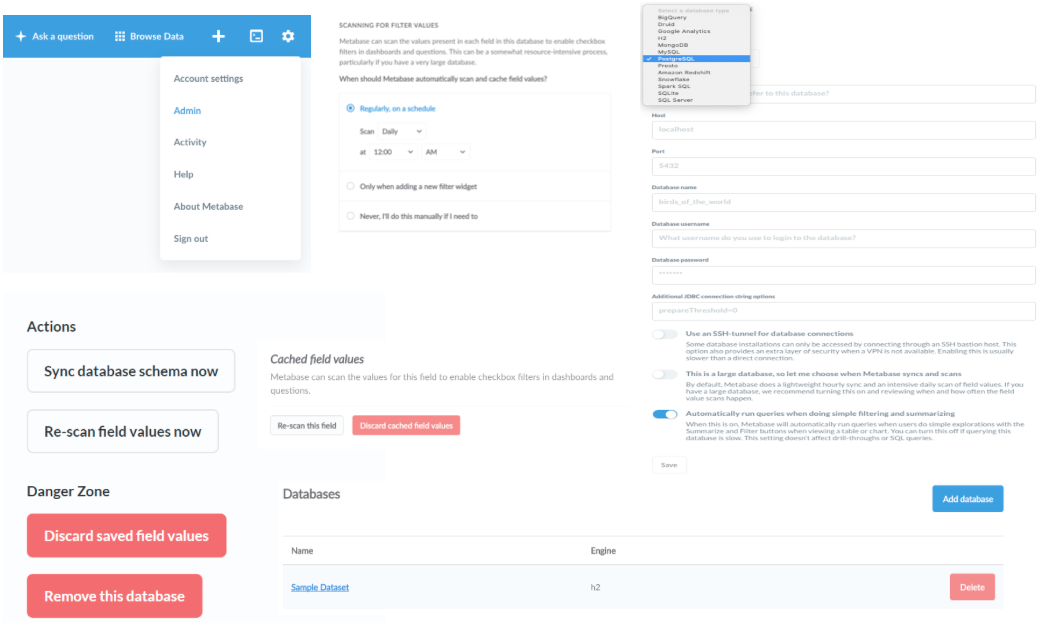
DB integration and related operations in Metabase
Plots and Dashboards in Metabase
Plots are referred to as Questions in Metabase. Plots can be created either by selections or SQL queries. In the case of creating questions via selection, access to the plotting portal can be obtained once the data (e.g., a table from a Postgres DB) is selected from one of the integrated DBs. On the contrary, an inbuilt SQL editor is available to create advanced questions using native SQL queries. Some of the plot types which are currently supported by Metabase include (refer here for more information):
- Line, Bar, Combination of Line & Bar
- Area, Row, Scatter
- Pie, Funnel, Trend
- Table, Map, etc.
Once individual plots or questions are created, they can be simply grouped to create dashboards as shown in the following figure. Various filtering options can be employed to navigate through the dashboard effectively. Data from the plots can be easily downloaded in various forms (e.g., csv, json, etc.). Public sharing can be activated in order to share (or to embed publicly in web pages & blogs) the plots and dashboards to anyone with the link. This way business insights can be shared across many people (or platforms) without them having to install Metabase.
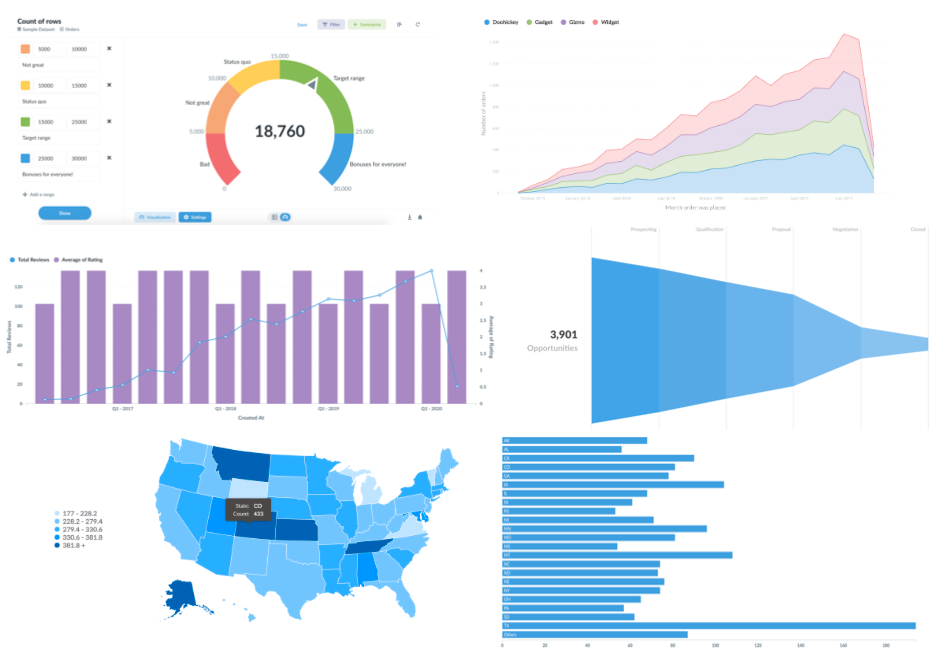
An example: Plots or Questions as a Dashboard in Metabase
Highlights
Metabase is definitely a promising BI tool for simple AI & ML business applications. Although it is subject to individual business needs, the following aspects may help individuals or organisations to weigh Metabase against other open-source (or possibly commercial too!) BI tools:
- Fairly simple to use
- Lacks ETL features
- Open-sourced with very detailed documentation
- Light application, thus easy to run in simple cloud computes
- Easy cloud deployment: one-click deployment support from developers
- Support to various databases & easy integration too
- Ability to download data in various forms from plots
- Ability to share plots & dashboards in Slack channels
- Ability to share or embed plots & dashboards outside of the application
- Nice full-screen visualisation of dashboards suitable for presentations
- Automatic exploration and plots-creation from data using a feature called Pulses
- Plots & dashboards of one DB will not automatically be replicated for another DB even if datamodel is exactly the same.